1 Lean SaaS Metrics – The Definitive Guide to Create Business Impact
This post provides SaaS entrepreneurs, Business Managers and Investors with an overview on the most relevant SaaS Metrics using the Lean-Case dashboard – a simulation tool to understand, create and validate the business model for a SaaS or any other subscription/recurring revenue business.
This post builds the foundation for a series of posts on understanding SaaS metrics, applying benchmarks, building a recurring revenue business model, scaling the right sales plan and win funding for your SaaS business with a lean case.
You will get a wide-ranging introduction to the key SaaS Metrics. We show you a comprehensive overview of metrics, provide pragmatic definitions, give simple examples, explain the calculations and offer short video tutorials.
The key element of this post is our Infographic “Lean SaaS Metrics Explained”. Please download it and feel free to share it:

The infographic shows how to calculate three different types of metrics from left to right.
Key Viability Metrics | showing the short-term Payback and long term LTV/CAC Ratio |
Key Unit Metrics | describing key customer metrics Customer Acquisition Cost, Lifetime Value, Annualized Lifetime Value and |
Key Deal Metrics | characterizing the Average Deal and the components of the CAC. |
The Infographic is based on the Lean-Case Simulation Dashboard. It calculates the 3 categories of metrics for a single Sales Unit and one customer on just one dashboard screen. Just launch the Lean-Case Simulation Dashboard to create your SaaS case. We illustrate each step in creating your case with pragmatic examples and short video tutorials below.
Using Lean-Case, you can validate your own SaaS Case.
2 Key Viability Metrics
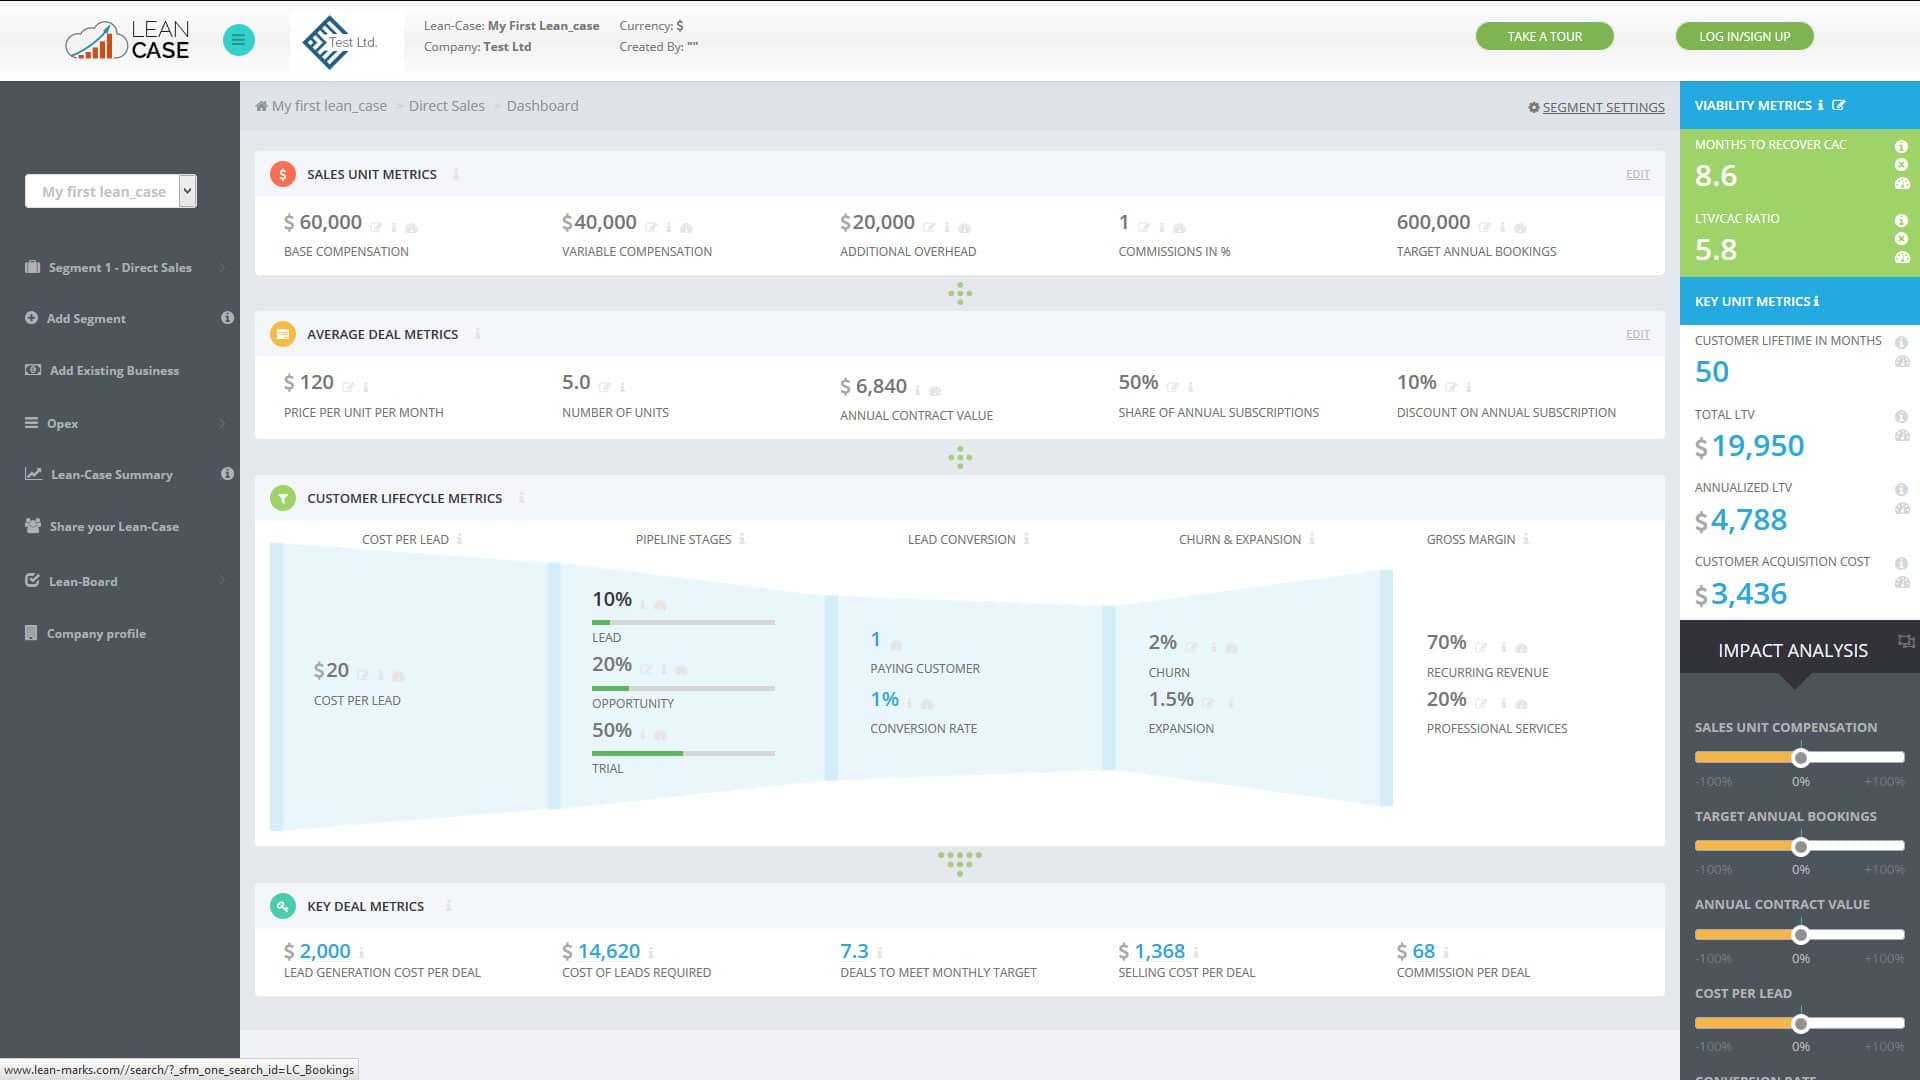
We are applying a simple “unit economics” model, i.e. we lay out the lifetime value (LTV) and the customer acquisition cost (CAC) for a single customer. Based on this, you can understand the short-term and a long-term indicator for your case and get a traffic-light indication ofthe viability of your case (see screen).
The short-term indicator “Payback Period” or “Months-to-Recover-CAC” defines how fast you recover the customer acquisition cost (CAC) over the lifetime of your customer
The long-term indicator “LTV/CAC ratio” also referred to as “God Metric” shows how many times the LTV exceeds the CAC
3 Key Unit Metrics
The Key Unit Metrics summarize the relevant customer key metrics: the Lifetime in Months, Lifetime Value (LTV) on a total and annualized base and Customer Acquisition Cost (CAC).
With a churn rate of 2%, the Customer Lifetime averages 50 months. Selling Cost, Cost of Leads and Partner Commission add up to a Customer Acquisition Cost of $3,436. At a Gross Margin of 70% of the Average Annual Contract Value, the Lifetime Value of a Customer is $19,950. On a 12-months basis, the Annualized Lifetime Value equals $4,788.
You’ll find handy definitions and examples for each of these metrics below.
3.1 Customer Lifetime in Months
Customer Lifetime in Months defines the average number of months for which a given class of customer pays revenues. It is calculated as 100% divided by the customer monthly churn rate.
If the churn rate is 2% – the average customer lifetime is 50 months.

3.2 Total Customer Lifetime Value (LTV)
The Total Lifetime Value (LTV) represents the monetary value of a customer across his lifetime. It is calculated by multiplying the Average Gross Profit per customer (which is the average monthly contract value multiplied by the Gross Margin for Recurring Services) by the Customer Lifetime in Months:

3.3 Annualized Lifetime Value
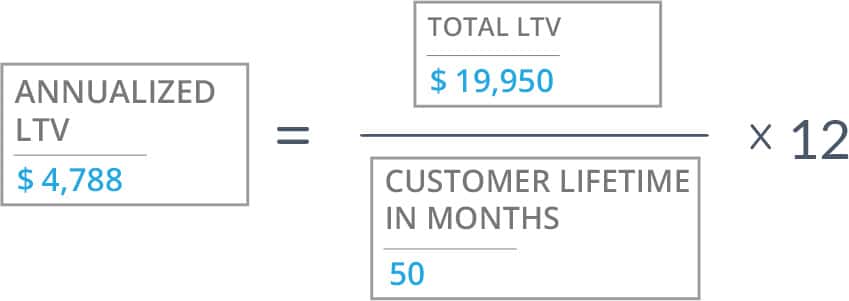
The Annualized Lifetime Value represents the value of a customer in the first year. It is calculated by dividing the Total Lifetime Value (LTV) by the Customer Lifetime in Months, then multiplied by 12.
3.4 Customer Acquisition Cost (CAC)
The Customer Acquisition Cost (CAC) is the sum of all Sales Unit related cost to acquire one customer (one deal). It sums up three Key Deal Metrics: (1) the Lead Generation Cost per Deal, (2) the Selling Cost per Deal and (3) Commissions per Deal. It does not include headcount cost related to sales-management and marketing.

4 Key Deal Metrics
Key Deal Metrics summarize relevant deal-related metrics such as Cost of Leads required, Lead Generation Cost per Deal, Selling Cost per Deal, Commission perDeal and Deals to meet Monthly target.
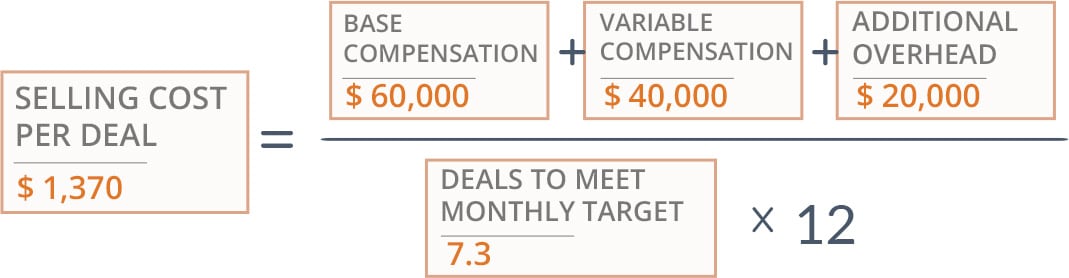
To Close one deal, the selling cost (the cost for Sarah and John) is $1,368 and the cost to generate leads for that deal is $2,000. In order to meet their monthly target, Sarah and John must close 7.3 deals per month. Given the conversion rate, the Cost of Leads Required (to meet the monthly target) is $14,620
You’ll find handy definitions and examples for each metric below.
4.1 Lead Generation Cost Per Deal
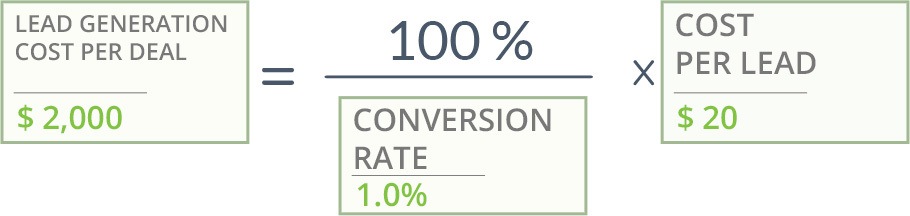
Lead Generation Cost Per Deal is the average cost required to produce enough leads to convert one of them into a Paying Customer.
Lead Generation Cost Per Deal are calculated as the average Cost per Lead multiplied by the Number of Leads Required. It does not include any headcount related cost linked to the Sales Unit (see Selling Cost per Deal).
4.2 Cost of Leads Required
Cost of Leads Required is the total amount of investment needed to produce the sales leads required to achieve the monthly target for the Sales Unit.
Cost of Leads Required is calculated by multiplying the Lead Generation Cost per Deal and the Deals to Meet Monthly Target (because Lean-Caseuses floating point calculations with several decimal places, results on dashboards might be slightly differentcompared to calculation with purely rounded numbers shown)

4.3 Deals to Meet Monthly Target
Deals to Meet Monthly Target is the number of new deals to be closed to achieve the monthly target of the Sales Unit

4.4 Selling Cost Per Deal
Selling Cost Per Deal is the average Sales Unit headcount cost of converting leads into a Paying Customer in a given sales unit. It takes the Sales Unit’s Base Compensation and Variable Compensation into account. It does not include any sales-management headcount cost.
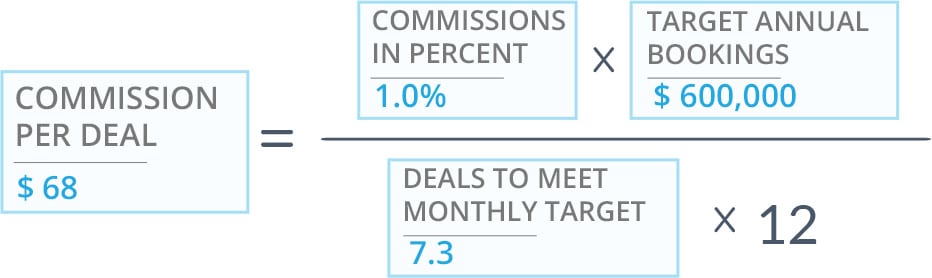
4.5 Commissions Per Deal
Commissions Per Deal is similar to the Selling Cost per Deal, but the calculation only includes commissions that are typically paid to external parties as a percentage of Bookings. It takes the Sales Unit Metric Commissions into account. It does not include any sales-management related headcount cost.